How to plan a complex trip
This is how I planned a 32-day trip to Asia for my mom, brother, and me.
In November of 2025, I had the privilege of visiting five countries in Asia: South Korea, Thailand, China, Taiwan, and Japan.
The journey lasted a total of 32 days, starting from the time I departed Canada until I returned. Everything was organized in a Google Sheets spreadsheet. Most of the information is in Portuguese so that my family, who do not speak English, could comprehend it. My mom and brother traveled from Brasília, Brazil, while I arrived from Vancouver, Canada.
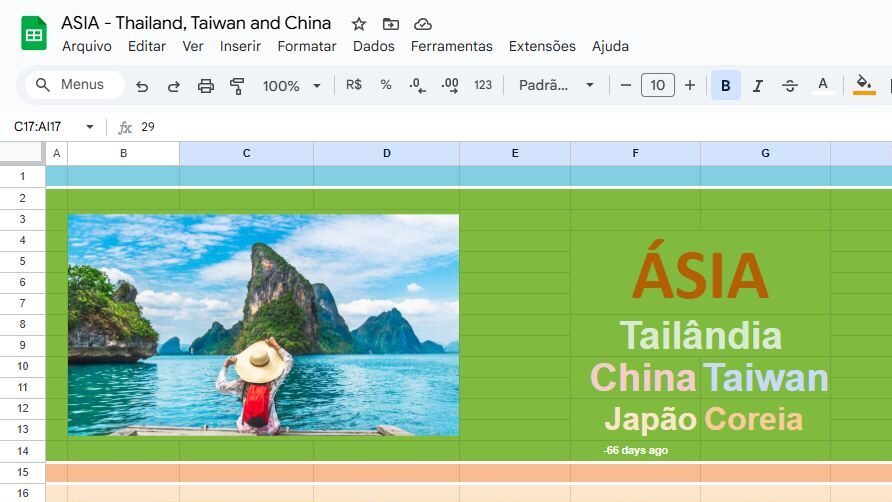
To have the best overview of the trip, I created a calendar with columns for each day, and rows for places, time, events, and hotels.
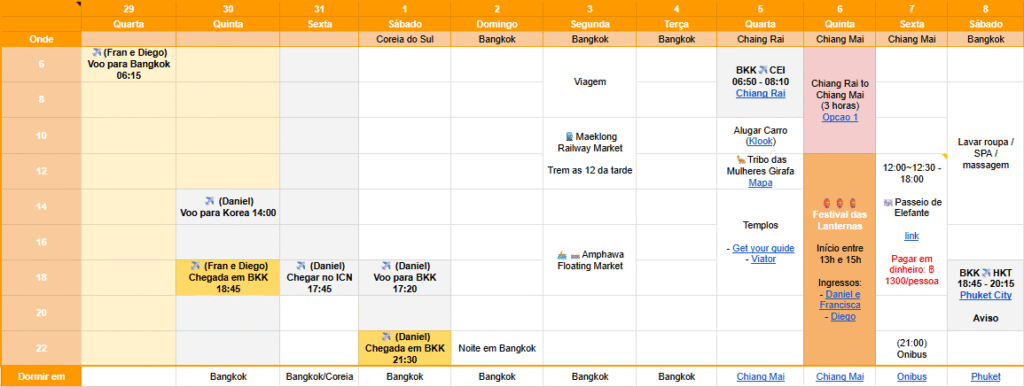
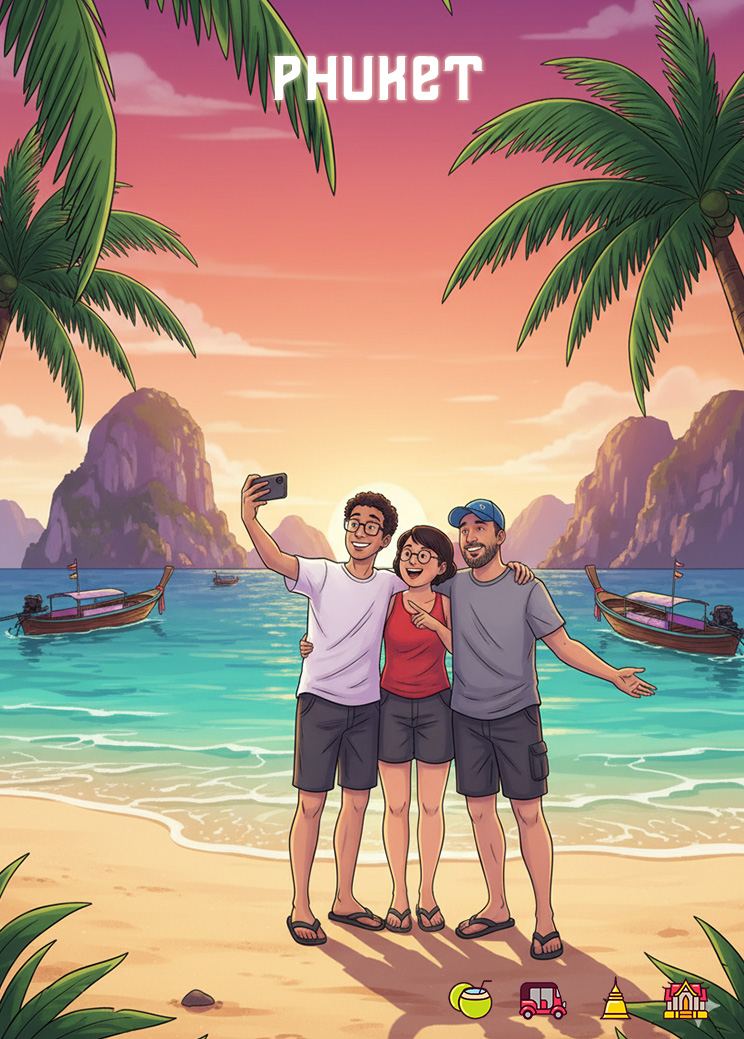
Our main goal was to attend the Lantern Festival in Chiang Mai. The event takes place on the first 2 days of full moon on November. In 2025, the event happened on November 5th and 6th, and in 2026, the event will happen on the 24th and 25th of November. With the intention to attend this event, My family and I planned to meet in Bangkok and travel together to Chiang Mai, which is a 1.5-hour flight to the North of Thailand.
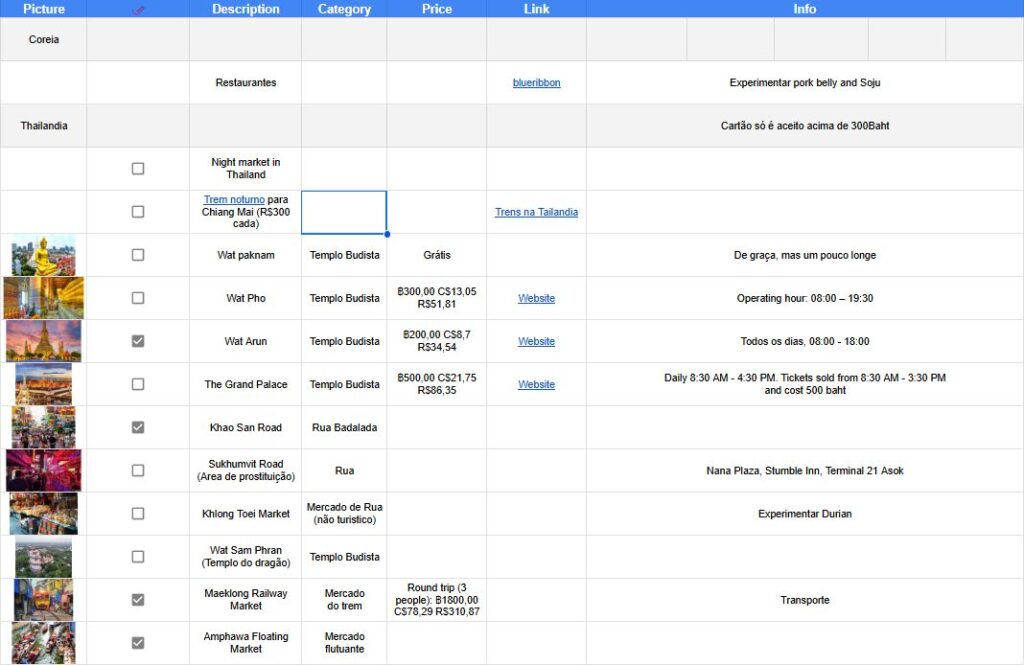
Whenever we plan a trip is very common to get overwhelmed with information. Our friends want to share their favorite sights, restaurants and streets, and very soon the algorithm of our social media floods us with videos, images, and advertisements. The best solution I found to avoid the FOMO was to have a place to “dump” all of these information, and sort them later whenever I have more time and patience available. For example, whenever I see something cool on my Instagram, like a reels or post, about an event that will be held at the place I’m going, I just save it on the Instagram itself, or I list it on a table on the spreadsheet.
The table has the columns: picture, “check” (if I am going for sure), description, category, price, link, info (extra information); and the rows with the individual place, restaurant or cafe, event, street, market, etc.
This system allows me to organize every information on one place and whenever I think about that information again I know exactly where to find it.
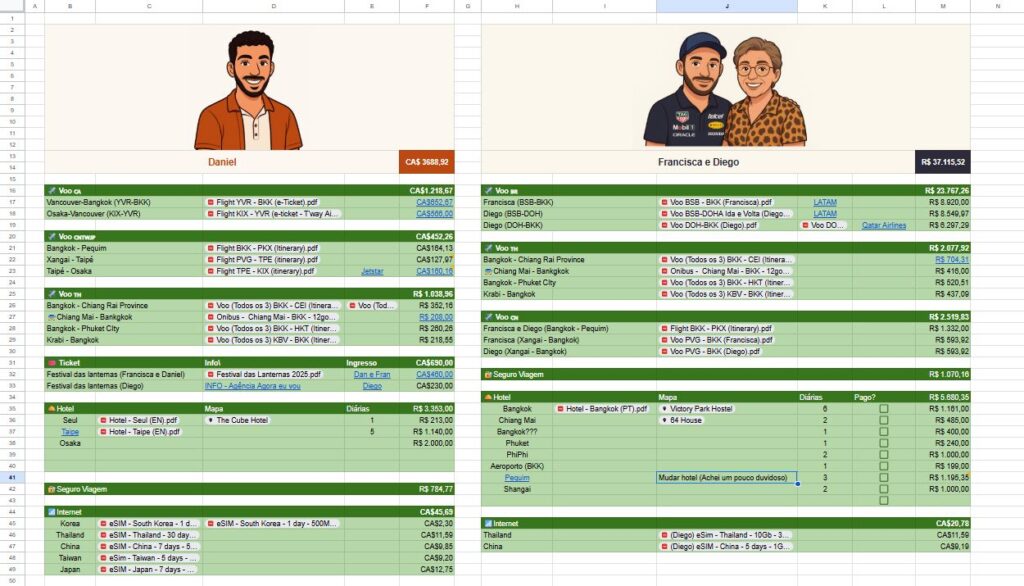
To organize the expenses and costs of the trip I created a separate page with individual tables for flights, tickets, hotels, insurance, internet packages, or any other major expense that happens. For the sake of organization, It’s very important to attach every receipt and itinerary document to this page. In many times, it will come handy to have everything at the same place
On the image bellow you can see how I organized the expenses. We have two separate “accounts”: Me (on the left) and My family (on the right).
For my account (“Daniel”) you can see the total amount spent in Canadian dollars, followed by three table of flights: Canada, Others, and inside Thailand. Below you can see the tickets, hotels, insurance, and internet tables with the according description, links, prices, and receipts. The equivalent organization happens on the other account (“Francisca e Diego”) the only difference is that my family paid with a different currency.
Another important area of the spreadsheets is the “to-do / done” area, where I arrange anything that should be done before the trip. The list can vary from getting a haircut, freezing gym membership, suspending phone bill, to getting vaccines, insurance, visas, international licenses, etc. Everything that needs to be done before the trip goes on these two tables: “to-do” and “done“.
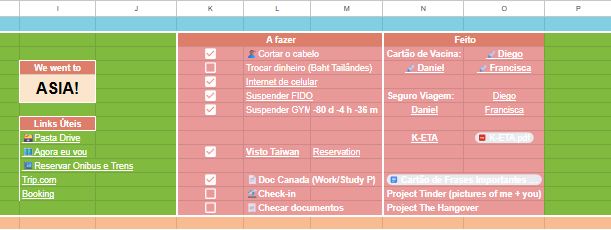
To complement the spreadsheet there is a Countdown and a list with useful links.
The countdown has 3 stages: before the trip, during the trip, and after the trip
Before the trip it shows a countdown of the amount of days until the first flight
During the trip it shows the message
“This is Asia. ENJOY!”
After the trip it shows the message
“We went to ASIA!”


The countdown has the formula below:
=IF(B1>=0;"Contagem";IF(B1<-16;"We went to";"This is ASIA"))In the referenced cell B1 there is the formula:
=DAYS(DATE(2025;10;30);NOW())How to plan a complex trip Read More »